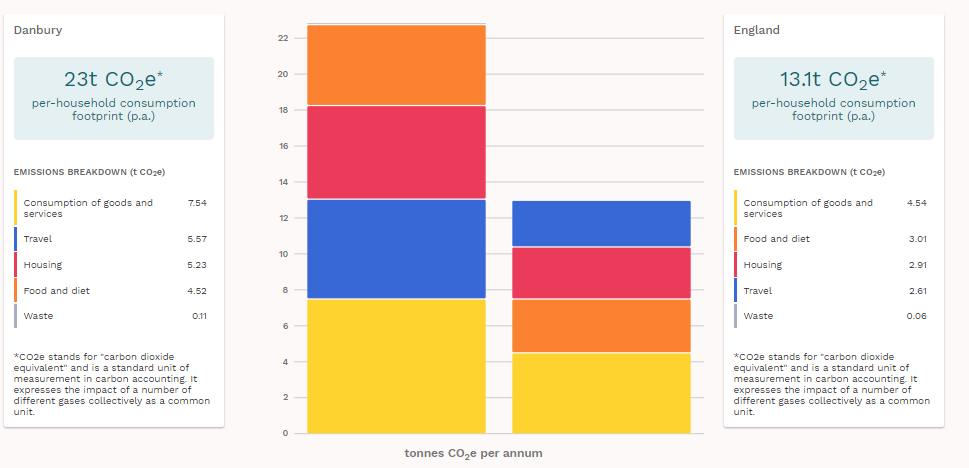

The graphic above shows the per household Carbon footprint of Danbury. The information is based on work done by the Centre for Sustainable Energy and is a parish-level carbon emission estimator. The tool (impact-tool.org) gives parishes and small communities usable data on their carbon emissions that is easy to interpret and share.
Unfortunately the data shows that Danbury is well above the national average for England (shown on the right of the graphic).
The graphic below (taken from a BBC article) shows some of the high impact changes that we can make. The figures are per person impact so if everyone in the household can make these changes it is possible to see how we can make significant overall reductions to our carbon footprint in Danbury.
There are also many carbon footprint calculators available, here a couple that you can try:
WWF (Worldwide Fund for Nature) has an easy to use calculator. Click here to access.
Climate Hero is a fun quiz that tests whether or not you are a 'Climate Hero' with lots of good suggestion on how to become one if you are not already! Click here to access.
Changes to the types of food we eat can make a substantial contribute to reducing our overall carbon footprint. However we don't all need to become vegan, just cutting down on some of the more carbon intensive food will make a difference. In particular red meat and dairy production requires much more CO2 than equivalents (see graphics below).
Further information and a look up guide is available in this BBC article from August 2019.
Serving size - 75g of beef, equivalent to one typical fast food hamburger.
Per 1 glass (200ml) serving
Source: BBC
© Copyright Sustainable Danbury
Make a free website with Yola